MetaTrader 4
MetaTrader 4, also known as MT4, is an electronic trading platform widely used by online retail foreign exchange speculative traders. The following page is dedicated to various MetaTrader 4 scripts that I have learned to create that execute simple long and short positions based off of the indicator the script observes. The scripts are implemented to execute trades at high and low frequencies depending on the strategy.
Moving Average Crossover
The moving average (MA) is a simple technical analysis tool that smooths out price data by creating a constantly updated average price. The average is taken over a specific period of time, like 10 days, 20 minutes, 30 weeks, etc... Crossovers are one of the main moving average strategies. We can apply two moving averages to a chart with one being over a longer period of time and the other one being over a shorter period of time. When the short term MA crosses above the long term MA, it's a buy signal and can indicate a trend is shifting up. On the other hand, if the short term MA crosses below the long term MA, it is a sell signal and can indicate a trend is shifting down.

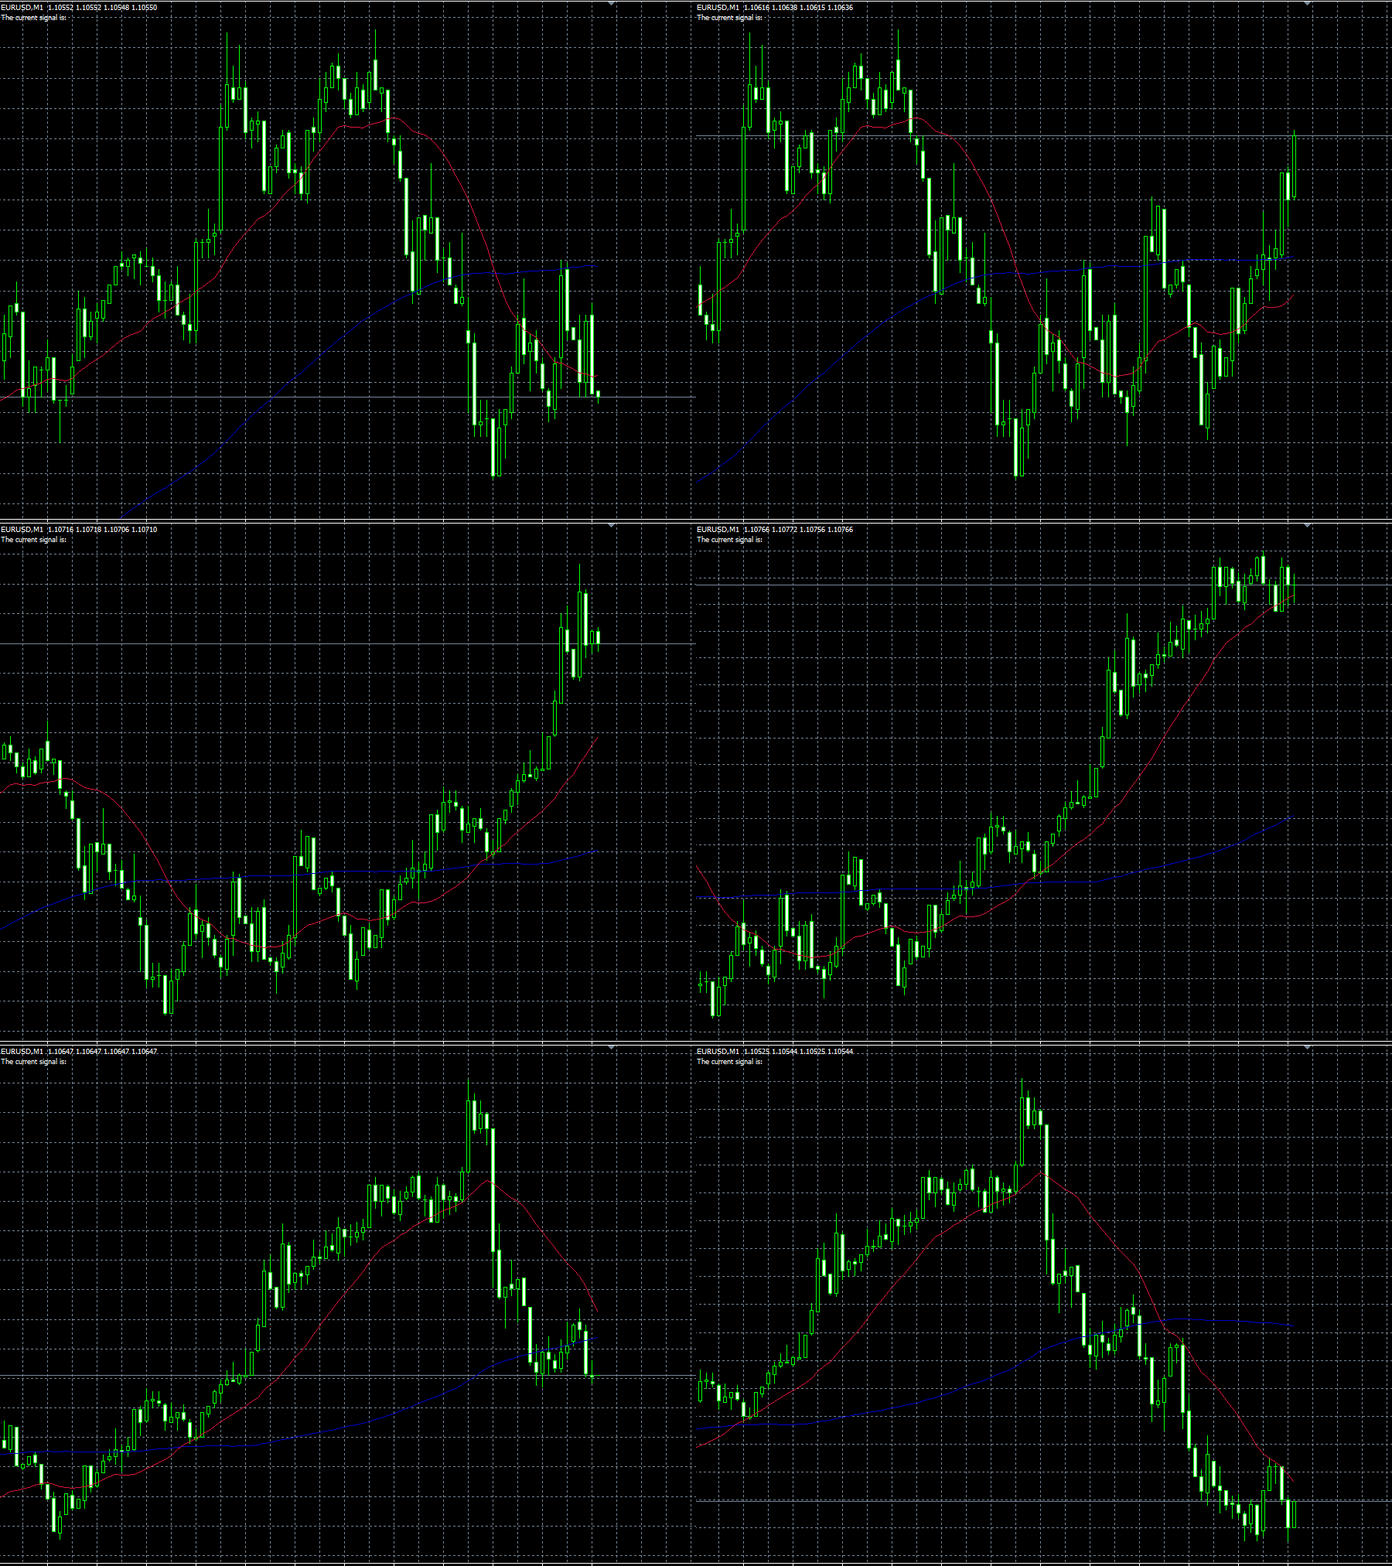
The above example is taken from MT4 backtesting data of the EUR/USD per minute. The script implemented above opens and closes buy and sell position based off of the positive and negative crossovers of the 30 candlestick MA (Red) and the 100 candlestick MA (Blue).
Moving Average Convergence Divergence (MACD)
MACD is a trend-following momentum indicator that shows the relationship between two moving averages. It is calculated by subtracting the 26-period Exponential Moving Average (EMA) from the 12-period EMA. The result of that calculation is the MACD line. A nine-day EMA of the MACD called the "signal line," is then plotted on top of the MACD line, which can function as a trigger for buy and sell signals. A simple strategy would be to buy when the MACD crosses above its signal line, indicating an upward momentum in the market, and sell when the MACD crosses below the signal line, indicating a downward momentum in the market.

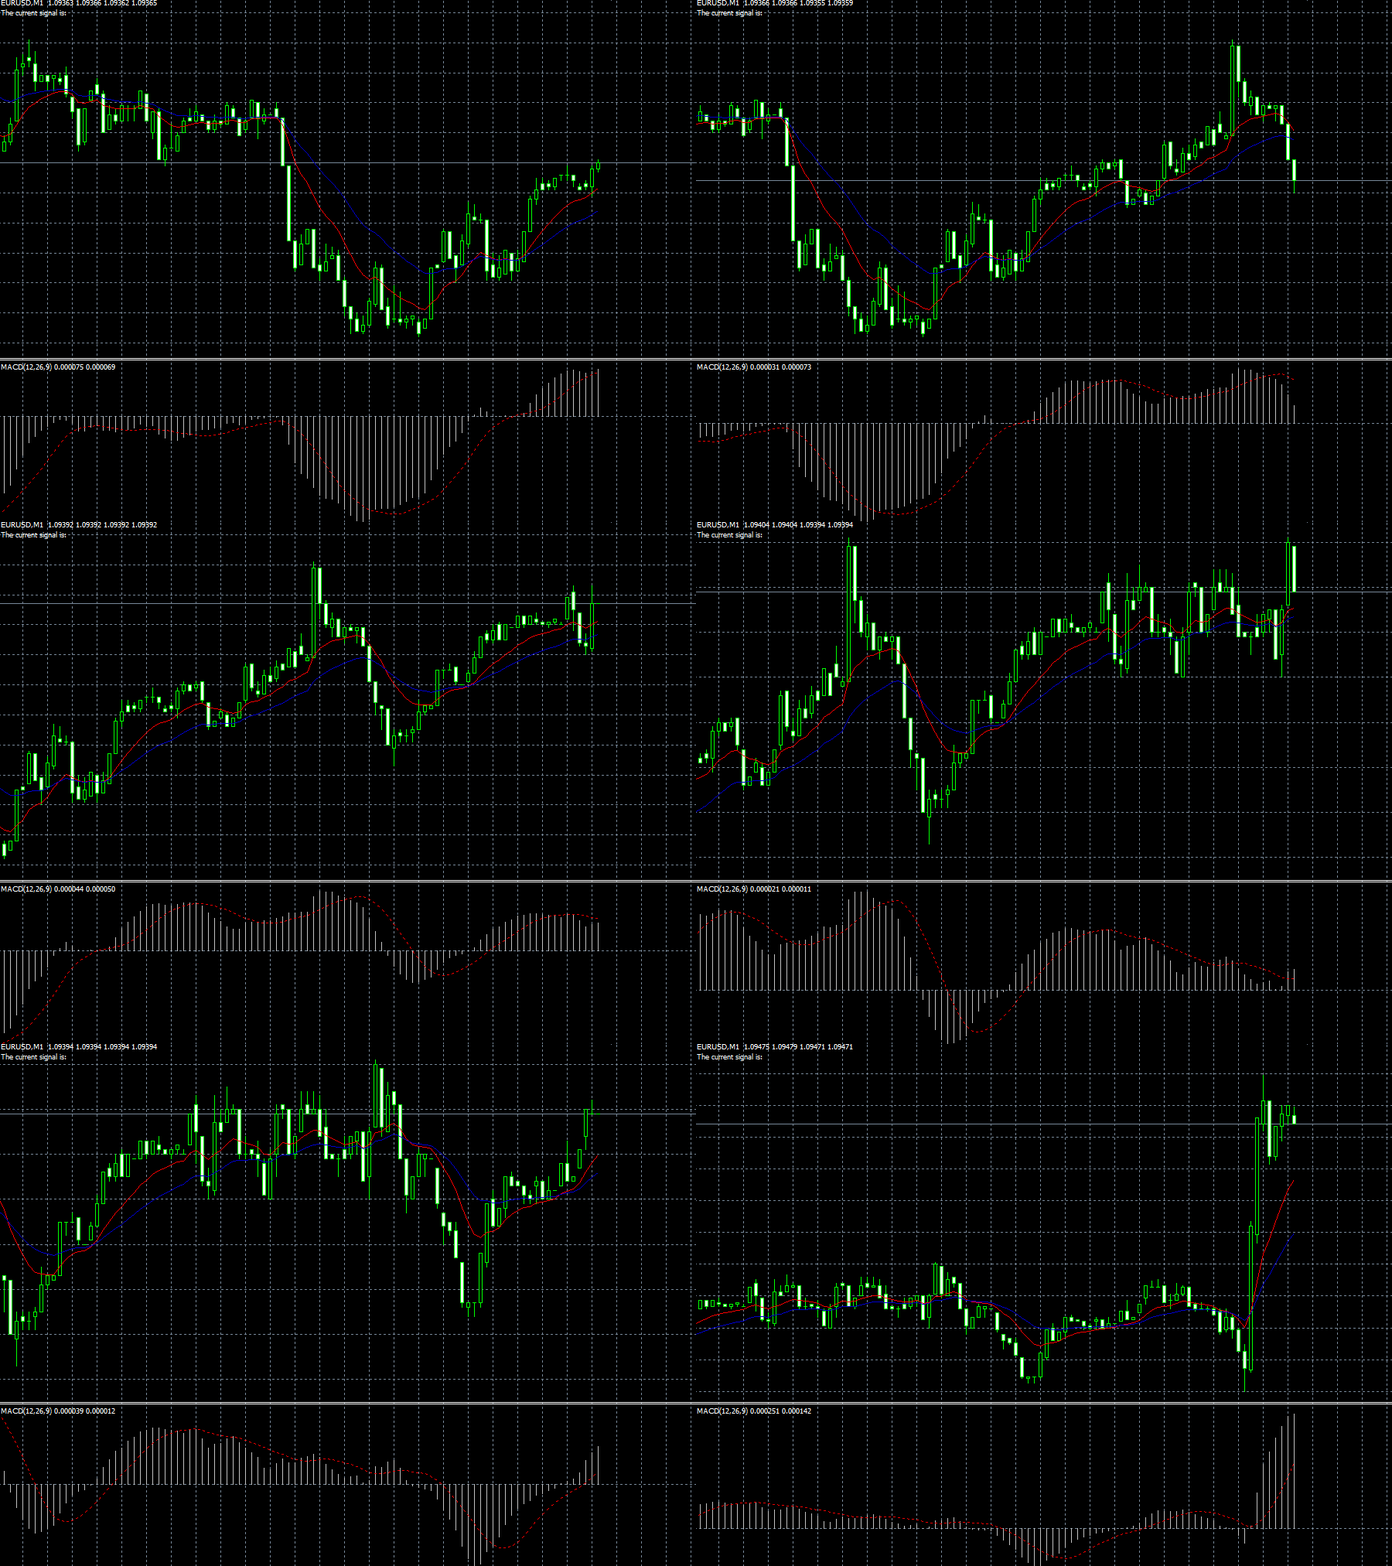
The above example is taken from MT4 backtesting data of the EUR/USD per minute. The script implemented above opens and closes buy and sell position based off of the intersection of the MACD line with the signal line. The histogram is representative of the distance between the MACD line and the signal line. When the histogram crosses the 0 line from positive to negative, the MACD line has crossed below the signal line and represents a sell signal. When the histogram crosses the 0 line from negative to positive, the MACD line has crossed above the signal line and represents a buy signal. The script calculates the current candle's MACD and compares it with the previous candle's MACD. If it is the case where the current MACD is greater than 0 and the previous MACD is less than 0, then we have had a positive MACD crossover. The opposite is true as well, where we have a negative MACD crossover if the current MACD is less than 0 and the previous MACD is greater than 0.
Relative Strength Index (RSI)
The relative strength index is a momentum indicator that measures the magnitude of recent price changes to evaluate overbought or oversold conditions. The RSI is displayed as a reading from 0 to 100. Traditionally, the RSI is considered overbought when above 70 and oversold when below 30. When either condition is met, the security might be primed for a trend reversal.

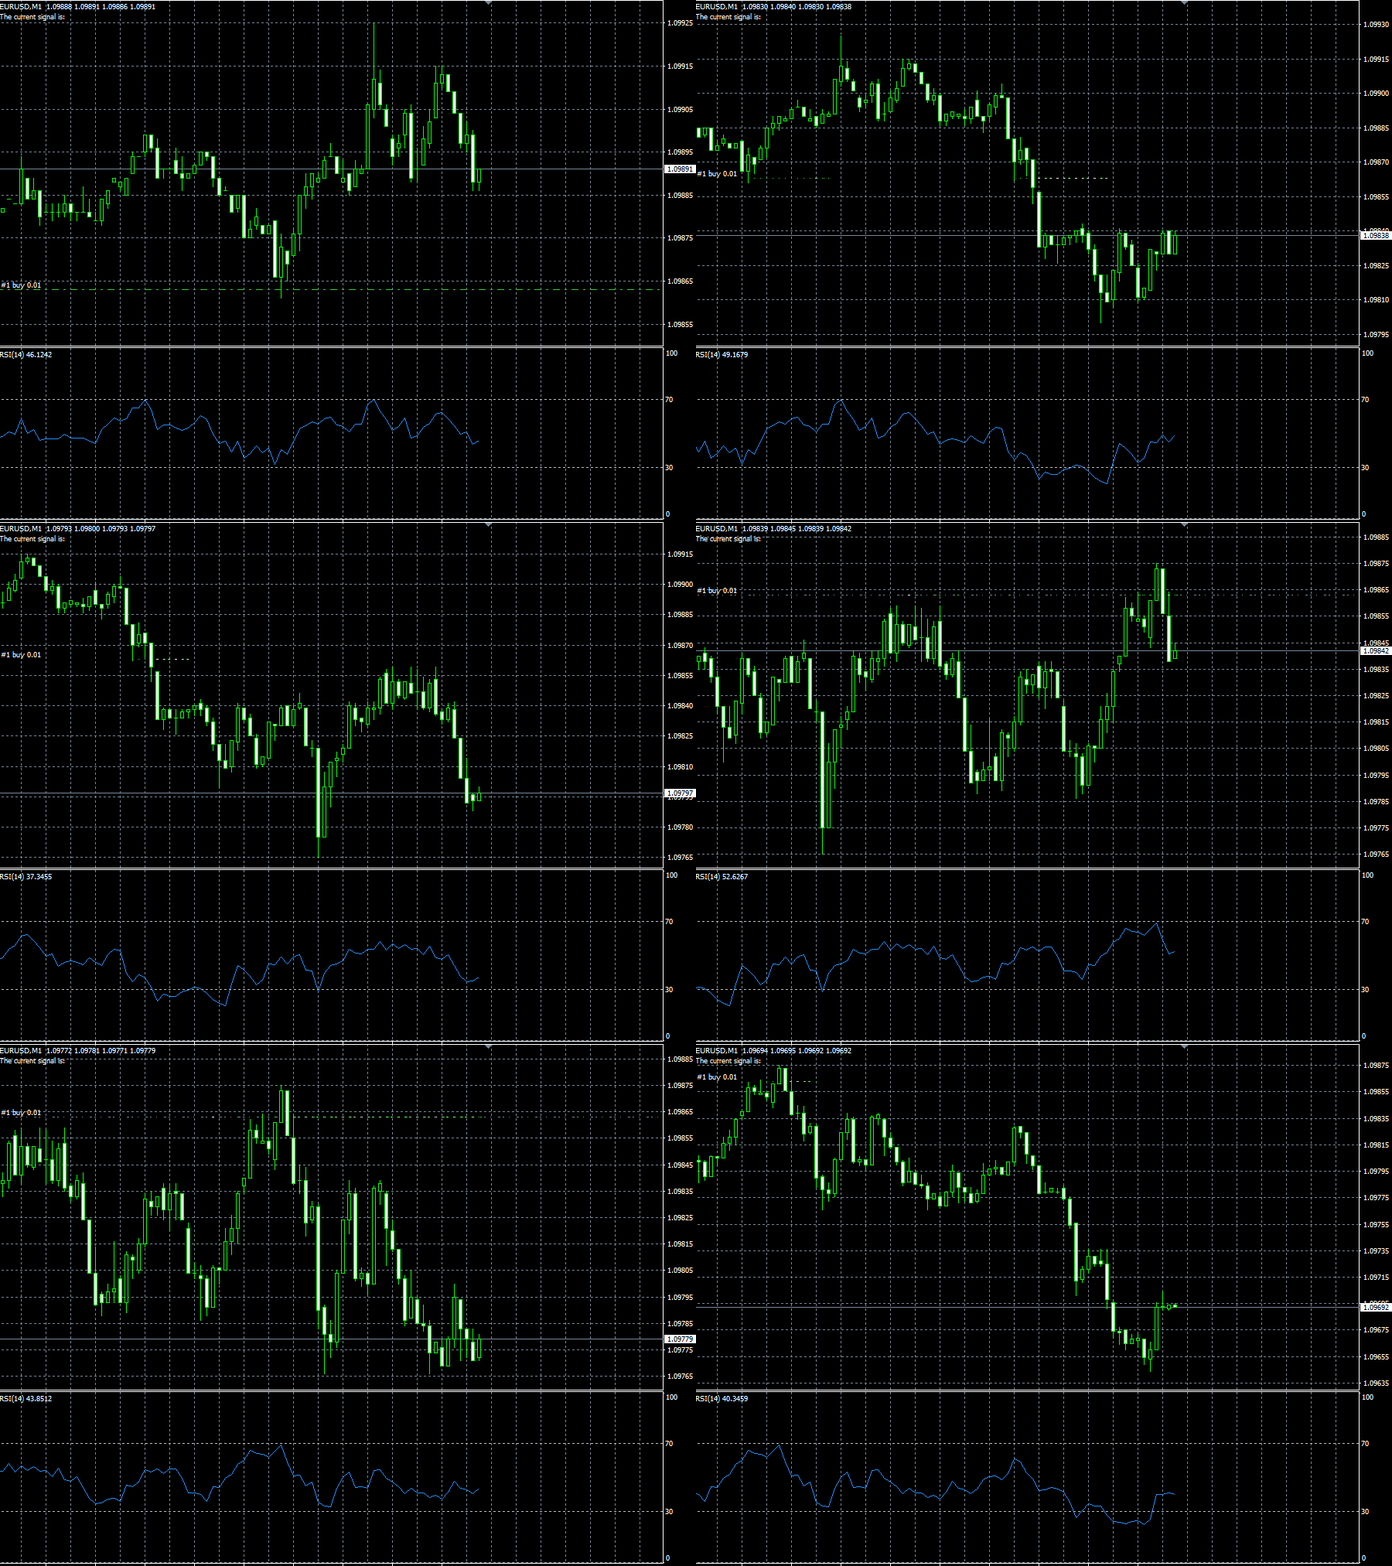
The above example is taken from MT4 backtesting data of the EUR/USD per minute. The script implemented above opens and closes buy and sell position based off of the value of the RSI. A simple strategy would be to open buy positions based on whether or not the RSI is less than or equal to 30, and open sell positions when the RSI is greater than or equal to 70.
Parabolic Stop and Reverse (PSAR)
The parabolic SAR is an indicator used to determine the price direction of an asset, as well as draw attention to when the price direction is changing. It is an indicator that is mainly used by to determine the future short term momentum. It is graphically shown on a chart of an asset as a series of dots placed either above or below the price depending on the asset's momentum. A small dot is placed below the price when the trend of the asset is upward, while a dot is placed above the price when the trend is downward.

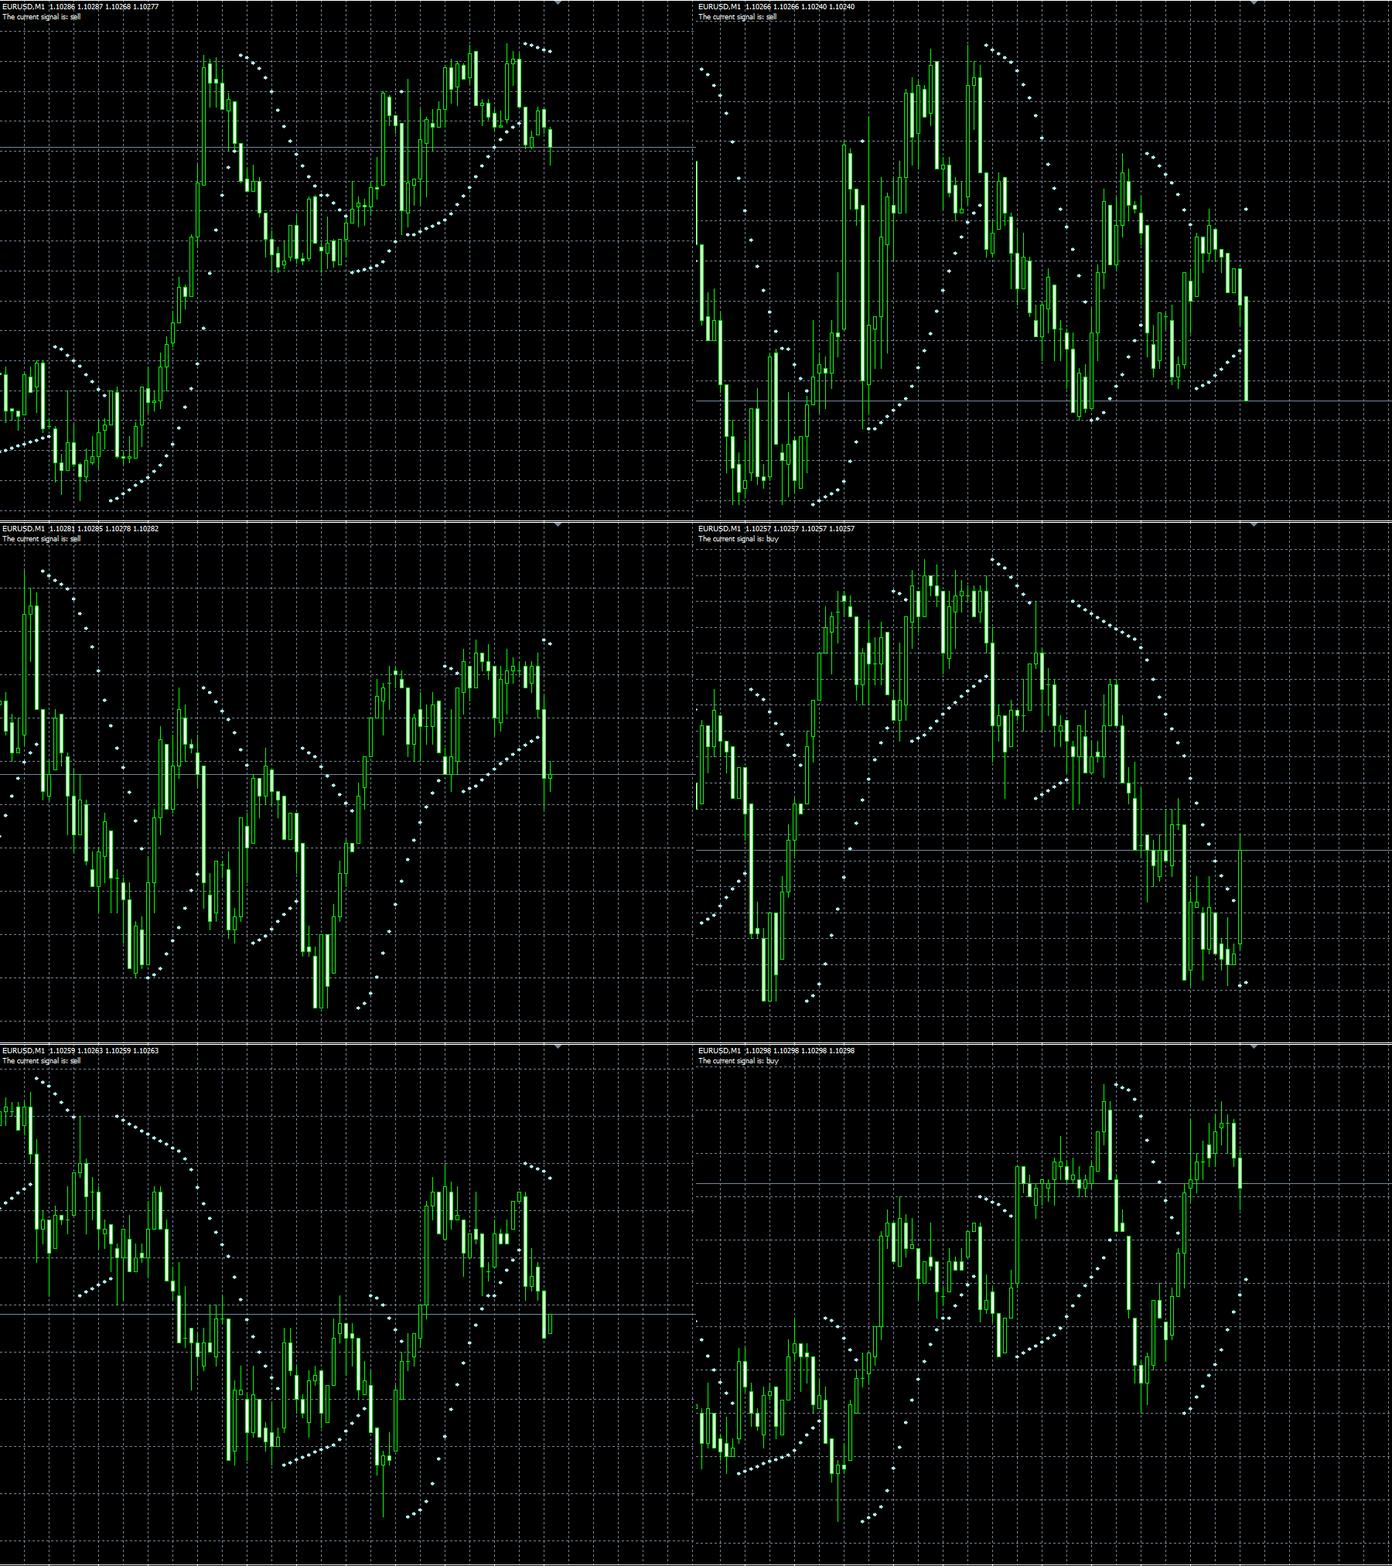
The above example is taken from MT4 backtesting data of the EUR/USD per minute. The script implemented above opens and closes buy and sell position based off if the closing price is greater than or less than the current PSAR value. A simple strategy would be to open buy positions if the PSAR value is less than the current bid price and open sell positions if the PSAR value is above the current ask price. The behavior of the script can be seen in the upper left hand corner of the graph, where the current signal is displayed.